
Available Time Is Not Operating Time
And confusing the two quietly breaks your performance metrics
Availability is one of the most widely used KPIs in industrial operations.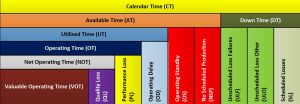
It shows up everywhere.
In maintenance scorecards.
In capacity models.
At the top of OEE dashboards.
And yet, it’s one of the most consistently misunderstood metrics on the plant floor.
A common assumption is that availability reflects how much time an asset is actually running and producing.
It doesn’t.
Availability simply tells you whether the asset could run. Not whether it did run.
That distinction matters more than most teams realize.
The problem with how availability is often used
When availability is treated as “uptime” or “production time,” it starts to absorb losses that don’t belong to it.
Suddenly, maintenance is being measured on things like:
- Lack of raw materials
- Upstream process interruptions
- Power outages
- Scheduling gaps
None of those are maintenance problems. But they show up in the number anyway.
The result is predictable.
Maintenance teams spend time defending the metric instead of improving it.
Operations teams disengage because the KPI doesn’t reflect their decisions.
And leadership loses a clear line of sight into what’s actually limiting production.
At that point, the KPI stops being useful.
A clearer way to think about time: the Time Usage Model
To fix this, you need to separate capacity from utilization from execution.
The simplest way to do that is by breaking time into distinct layers.
Start with the total possible time:
Calendar Time (CT)
This is the full window.
24 hours in a day. 168 hours in a week.
From there, remove time when the asset physically cannot run:
- Planned maintenance
- Breakdowns
- Mechanical or electrical failures
What remains is:
Available Time (AT)
The asset is capable of running.
This is where availability lives. And it should stop here.
Next, consider whether the asset has what it needs to operate.
Even if a process is available, it may be stopped due to factors outside of the equipment itself:
- No feed or upstream supply
- No power
- No consumables
- External constraints or logistics issues
After removing these, you get:
Utilized Time (UT)
The asset is available and has what it needs to run.
Finally, look at how effectively that utilized time is executed.
Even when everything is lined up to run, there are still operational interruptions:
- Shift changes
- Safety meetings
- Cleaning cycles
- Changeovers
Remove these, and you arrive at:
Operating Time (OT)
This is the time the process is actually running and producing.
The full picture
When laid out properly, the flow looks like this:
CT → AT → UT → OT
Each step isolates a different type of loss.
Each step answers a different question.
- Can the asset run? → Availability (AT/CT)
- Does it have what it needs to run? → Utilization (UT/CT)
- Are we running it? → Effective Utilization (OT/CT)
Why this separation changes behavior
The real value of this model isn’t just better math. It’s better accountability.
When you calculate KPIs at each step:
- Availability (AT / CT) reflects maintenance and reliability performance
- Use of Availability (UT / AT) reflects planning, scheduling, and coordination
- Operating Efficiency (OT / UT) reflects day-to-day operational execution
Now each team owns a piece of the outcome they can actually influence.
That changes how conversations happen.
Instead of debating a single blended number, teams can focus on the specific losses in their control.
Maintenance can target failure modes.
Planning can address supply and scheduling gaps.
Operations can reduce delays and improve run discipline.
The metric stops being political and starts becoming diagnostic.
The hidden cost of lumping everything into “Availability”
When all losses are forced into one number, three things tend to happen:
- Misplaced accountability
Teams are held responsible for problems they don’t control. - Loss of ownership
Real issues fall through the cracks because no one clearly owns them. - Poor decision-making
Investments and improvement efforts are directed at the wrong constraints.
Over time, this erodes trust in the data itself.
And once that happens, even good metrics stop driving action.
What good looks like
A well-structured KPI system does more than report performance.
It points directly to where action is needed and who should take it.
When availability, utilization, and effective utilization are clearly separated:
- Problems become easier to diagnose
- Conversations become more objective
- Improvement efforts become more targeted
And most importantly, performance actually moves.
Final thought
Availability is not a measure of production.
It’s a measure of capability.
Confusing it with operating time might seem harmless, but it blurs accountability and hides the real sources of loss.
If you want KPIs that drive behavior instead of debate, start by separating the time usage model.
Everything else gets clearer from there.